Module 7 Lab: Security and access governance#
Design role-based access and audit logging.
Lab Context#
This lab uses synthetic pipeline events with freshness, schema drift, lineage completeness, volume, and access-risk indicators as a safe proxy for the course setting. It is not a substitute for institutional data, but it lets you practice the reasoning, metrics, and documentation pattern before working with real records.
Lab Tasks#
Run the baseline analysis.
Identify the decision the metric supports.
Change one threshold, score weight, or input assumption.
Compare the result before and after your change.
Record one deployment risk that the synthetic data cannot reveal.
import numpy as np
import matplotlib.pyplot as plt
rng = np.random.default_rng(7)
n = 80
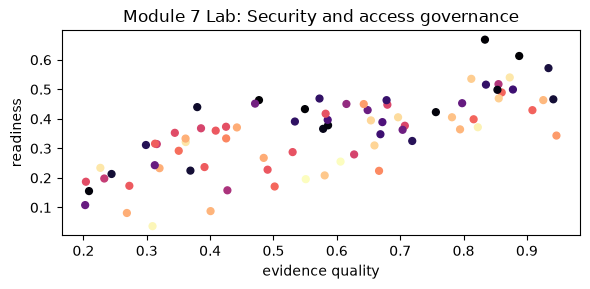
evidence_quality = rng.uniform(0.2, 0.95, n)
operational_fit = rng.uniform(0.1, 0.9, n)
risk = rng.uniform(0.05, 0.8, n)
readiness = 0.45*evidence_quality + 0.35*operational_fit - 0.20*risk
plt.figure(figsize=(6, 3))
plt.scatter(evidence_quality, readiness, c=risk, cmap="magma", s=24)
plt.xlabel("evidence quality")
plt.ylabel("readiness")
plt.title("Module 7 Lab: Security and access governance")
plt.tight_layout()
{"mean_readiness": float(readiness.mean()), "highest_readiness_case": int(np.argmax(readiness)), "highest_risk_case": int(np.argmax(risk))}
{'mean_readiness': 0.3516483500062133,
 'highest_readiness_case': 75,
 'highest_risk_case': 9}
reflection = {
    "what_changed": "",
    "metric_before": "",
    "metric_after": "",
    "interpretation": "",
    "synthetic_data_limit": "",
    "next_real_world_evidence_needed": "",
}
reflection
{'what_changed': '',
 'metric_before': '',
 'metric_after': '',
 'interpretation': '',
 'synthetic_data_limit': '',
 'next_real_world_evidence_needed': ''}